National Liquefaction Model (NLM)
The National Liquefaction Model (NLM) shows where liquefaction is more or less likely around New Zealand during earthquakes. The model is primarily for people who work in natural hazard risk reduction – like council planners, researchers and insurers.
Why we developed the NLM
Liquefaction is one of the most damaging earthquake hazards in New Zealand, because of our young and loose soil. After the Canterbury earthquakes, liquefaction damage accounted for over half of the total payouts.
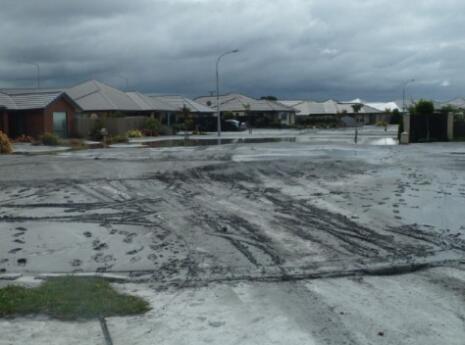
Liquefaction land damage in Christchurch, 2011.
Liquefaction is a hazard where strong earthquake shaking causes the ground to temporarily lose strength and behave like a liquid – damaging land and buildings.
We commissioned engineering consultancy Tonkin + Taylor to develop the NLM, using the latest liquefaction science and earthquake modelling.
The model helps quantify potential land and building damage and losses from liquefaction.
Filling a gap in our national data
Before the NLM, liquefaction modelling was uneven across New Zealand. Some regions have had detailed information while others have very little. Without nationally consistent data, it’s difficult to model risk properly.
The NLM – New Zealand’s first publicly available national scale liquefaction model – helps fill that gap.
The NLM does not provide information about properties
The model does not provide information about liquefaction risk for an individual property or neighbourhood. Because of this, it is not suitable for:
- making building consent decisions or other site-specific assessments
- setting or changing retail insurance premiums
- determining individual property values.
If you need advice about a specific property, talk to a qualified geotechnical professional.
Visit the NLM website
The NLM Portal requires a Microsoft or Google account to access it. It requires technical expertise to interpret the data and includes disclaimers and limitations to guide appropriate use.
Visit the NLM portal(external link)
Resources for technical users
If you work in risk modelling, research, planning or insurance, these resources may help with interpreting the model’s outputs:
- NLM final technical report(external link)
- Automated Liquefaction Vulnerability Categories (ALVC) maps - full report(external link)
- ALVC maps - report summary(external link)
- How liquefaction-prone land is assessed and managed(external link) (MBIE/MfE resource)
- Guidance for including natural hazard information in LIMs(external link) (DIA resource)
- Scenario based guidance for including natural hazard information in LIMs(external link) (DIA resource)
- FAQs on using and interpreting the NLM [PDF, 113 KB]
- Info for natural hazard risk sector [PDF, 257 KB]
- Info for finance sector [PDF, 252 KB]
- Info for government [PDF, 257 KB]
Find property information
If you want detailed information about a specific property, it’s best to talk to your local council or get independent advice from a qualified geotechnical professional.
Watch: Jo Horrocks and James Russell explain the NLM
00:00:00:10 - 00:00:23:07
Unknown
New Zealand is an earthquake prime country because much of our land is made up of relatively young, loose soils. Liquefaction can be a significant natural hazard. Liquefaction happens during strong earthquake shaking when soil loses strength and acts a bit more like a liquid. When that happens, land can sink or spread, and buildings, roads and pipes can be badly damaged.
00:00:23:09 - 00:01:04:11
Unknown
We saw this clearly in the Canterbury earthquake sequence. Liquefaction was a factor in around 15% of insurance claims, but accounted for more than 50% of the total payout. Those events highlighted the need to better understand where liquefaction is more likely to occur in the future. That's why we funded the development of New Zealand's first national liquefaction model. This model gives us a big picture view of where liquefaction could occur during earthquakes, helping us better understand potential damage and losses across the country from future events, demonstrating strong understanding and management of our risks also helps us secure reinsurance, helping keep natural hazards insurance accessible for New Zealanders.
00:01:04:13 - 00:01:29:03
Unknown
The national liquefaction model is also designed to support other people who make planning and risk reduction decisions, like councils, researchers and insurance providers, and it's publicly available for an online portal for that reason. The model was developed by Tonkin and Taylor using the latest liquefaction science and is quake modelling, much of which has advanced significantly since the Christchurch earthquake.
00:01:29:05 - 00:01:59:24
Unknown
It brings together information about soil conditions, landforms, groundwater and earthquake shaking to provide consistent regional scale insights into liquefaction risk. Until now, liquefaction has been modelled unevenly across New Zealand. Some regions have detailed information, while others have very little. This model helps level the playing field by providing a nationally consistent approach while the model is publicly accessible. Technical expertise is required to interpret its outputs appropriately.
00:02:00:04 - 00:02:26:06
Unknown
Throughout development, we worked closely with local and central government research organisations and the insurance sector to ensure the model strengths and limitations are well understood. The national liquefaction model shows us broad patterns across regions, but it can't tell you about liquefaction risk for an individual property or neighbourhood. If you're concerned about liquefaction risk where you live, your local council and advice from qualified professionals are still the best place to start.
00:02:26:07 - 00:02:37:20
Unknown
We'll continue updating the model as new data and sites become available. Ultimately, this work helps New Zealand better understand earthquake risk, reduce future damage, and build more resilient communities.